.png?width=2404&height=783&name=Chuchi%20Perez%20(1).png "Chuchi Perez (1)")
-1.png)
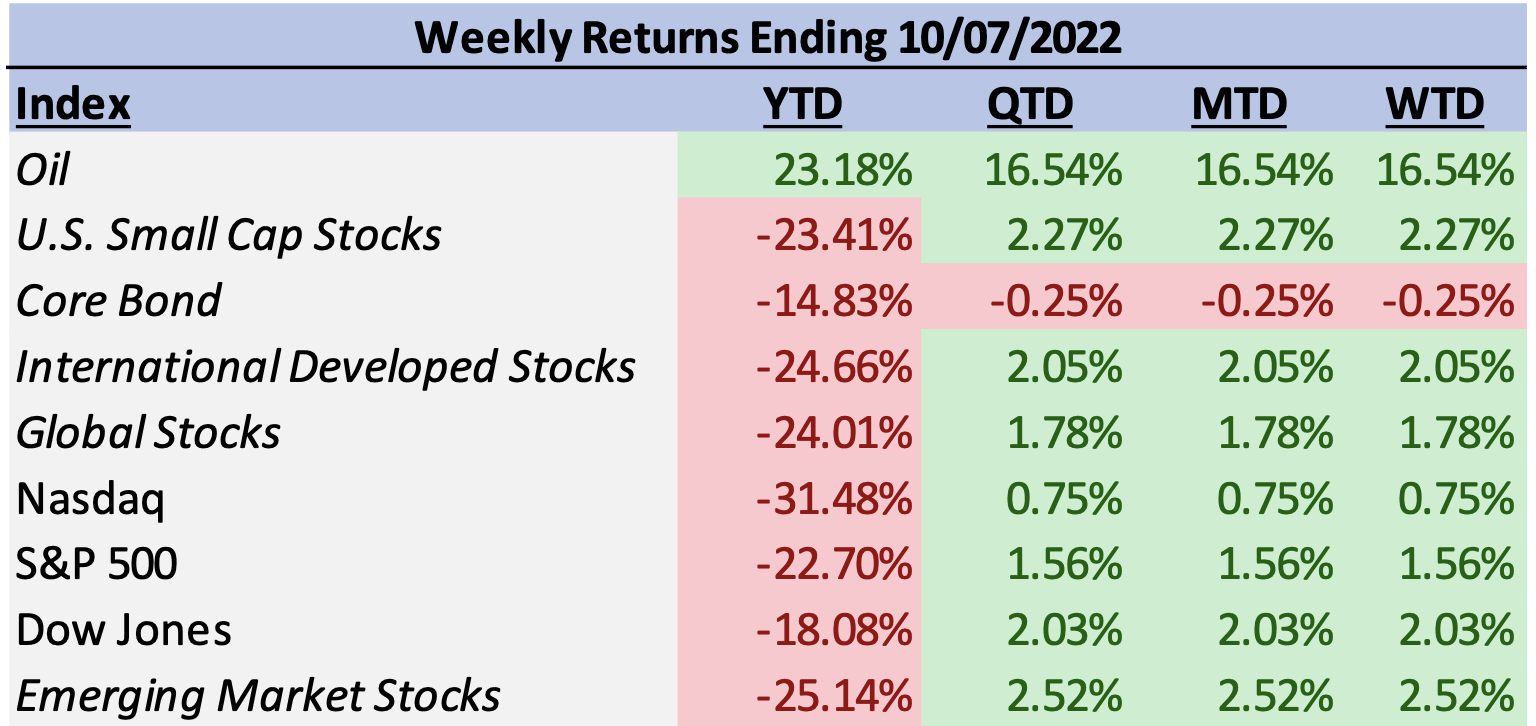
Last week marked the beginning of the final quarter for 2022, and while it saw its fair share of volatility throughout the week, stocks ended the week positive. The S&P 500 ended the week up 1.56%. The strongest performing sector among U.S. large caps was energy, which off the heels of a rally in oil prices ended the week 13.86% higher. While of lesser magnitude, additional leadership came from the industrials (2.87%), materials (2.15%), financial services (1.94%), communication services (1.70%), and technology (1.67%) sectors. Healthcare (1.33%) lagged the S&P 500 but still finished positive, while consumer staples (-0.36%), consumer discretionary (-2.63%), utilities (-2.63%), and real estate (-4.06%) all finished lower for the week. U.S. small cap stocks outgained their large cap counterparts, with the Russell 2000 index returning 2.27% to start the fourth quarter. Foreign stocks also outpaced large cap stocks in the U.S., as international developed stocks (MSCI ACWI ex US index) and emerging market stocks (MSCI Emerging Markets index) gained 2.05% and 2.52% respectively. Treasury yields made significant moves throughout the week but ultimately ended the week just slightly higher, helping to drive the Barclays Aggregate Bond index lower for the week at -0.25%.
Investors’ eyes this week will be on the widely watched CPI and PPI reports as market participants continue to closely monitor the direction of inflation, and through that, extrapolate to what degree and how long the Federal Reserve’s restrictive monetary policy might persist. Much of the market’s recent volatility has likely been rooted in this same Fed-based speculation and its resulting impact on economic forecasts, bond yields, and ultimately investors’ valuation of the stock market.
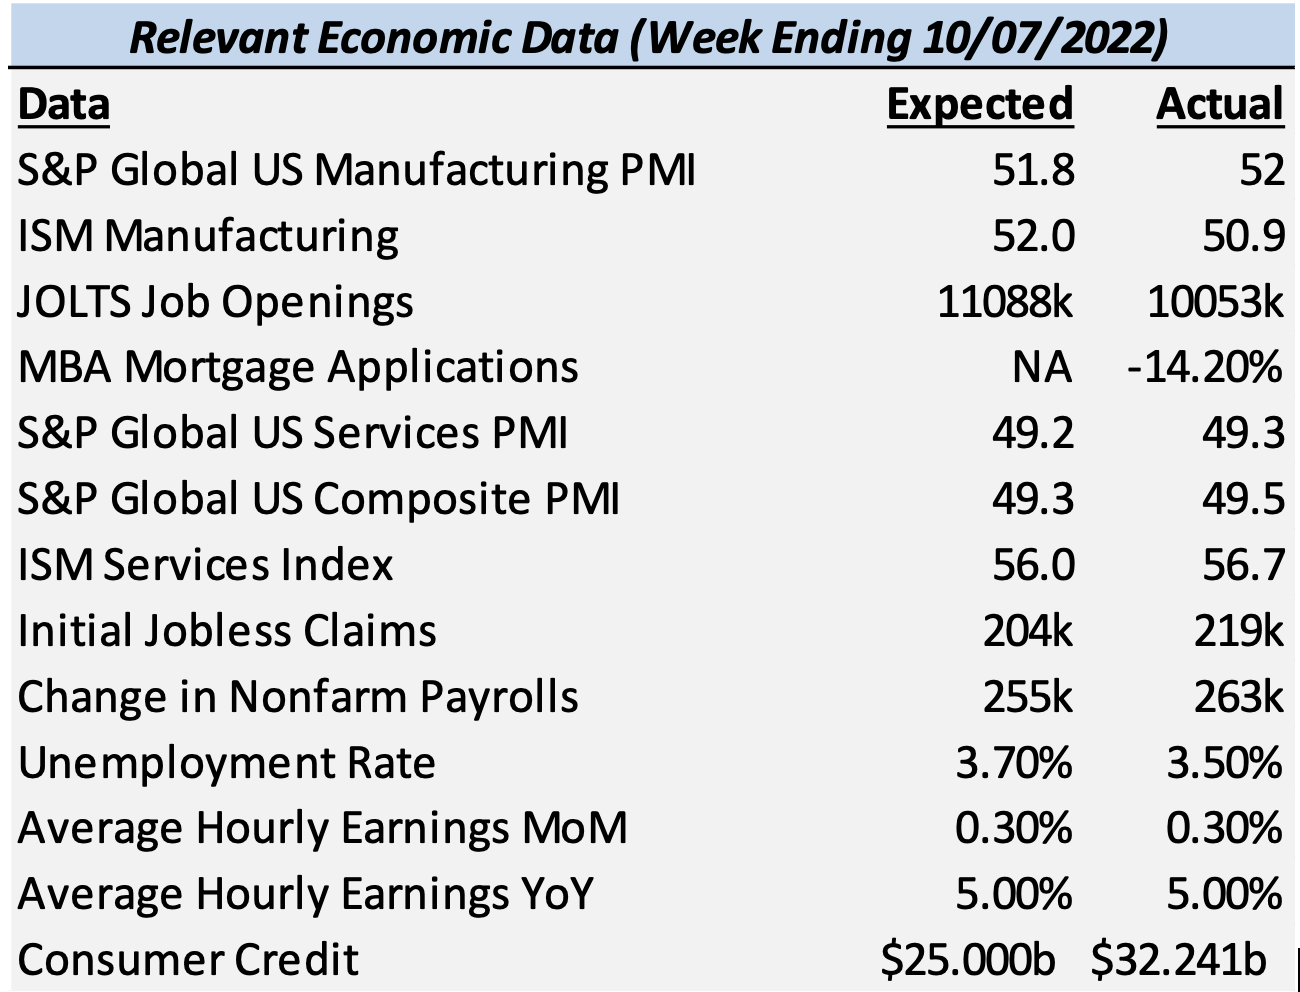
Last week’s economic data somewhat acted as a setup to the high-profile inflation reports that will be released this week. When taken as a whole, the takeaway from last week’s reports may suggest an economy that continues to run hotter than expected. The S&P Global PMI reports, which act as a leading indicator and are a collection of surveys used to gauge the health of economies and their subsets (manufacturing and services), all came in higher than expected. These reports did however show a composite reading of 49.5 which, at below 50, indicates a value that is contracting not expanding. The ISM reports, utilizing a different methodology for the same gauging purposes, were also higher than expected but were above 50, pointing to expansion not contraction.
On the labor market side of the economic equation, the jobs market remains tight and resilient despite the Federal Reserve’s policy actions to date. The most recent period’s unemployment rate reported a value of 3.5% which was even lower than the consensus analyst estimate of 3.7%; in fact, the latest value was a decline from the previous period’s rate of 3.7%. Part of the change was a result of a small drop in the labor force participation rate (from 62.4% to 62.3%), but the higher-than-expected change in nonfarm payrolls (263k) provided another data point pointing to a tight labor market. Average hourly earnings continued to rise on a month-over-month and year-over-year basis, albeit in line with analyst expectations.
We believe that the bulk of this data points to an economy that maintains its resiliency and, as a result, continues to warrant restrictive monetary policy from the Fed. However, there were a few leading data points that we believe showed some impacts of their policy to date are already being felt. MBA mortgage applications fell for the second week in a row. It was the seventh negative weekly reading in the last eight reports, and at -14.2%, the steepest weekly decline since April 2020. With the average 30Y fixed rate mortgage having more than doubled in value to 7.04% year-to-date, these declines are not entirely surprising. In addition to this, the job market while currently strong has shown some cracks as of late. Initial jobless claims came in higher than expected for the week which was the first reading above analyst expectations since July. Last week’s JOLTS report (Job Openings and Labor Turnover Survey) for the month of August came in lower than expected. The report showed a decrease in job openings while hires and total separations changed little. Finally, the Federal Reserve reported that outstanding consumer credit increased at a much higher rate than analysts’ expected. This will be an important metric to continue to watch and is another sign of the inflation related stresses being felt by consumers.
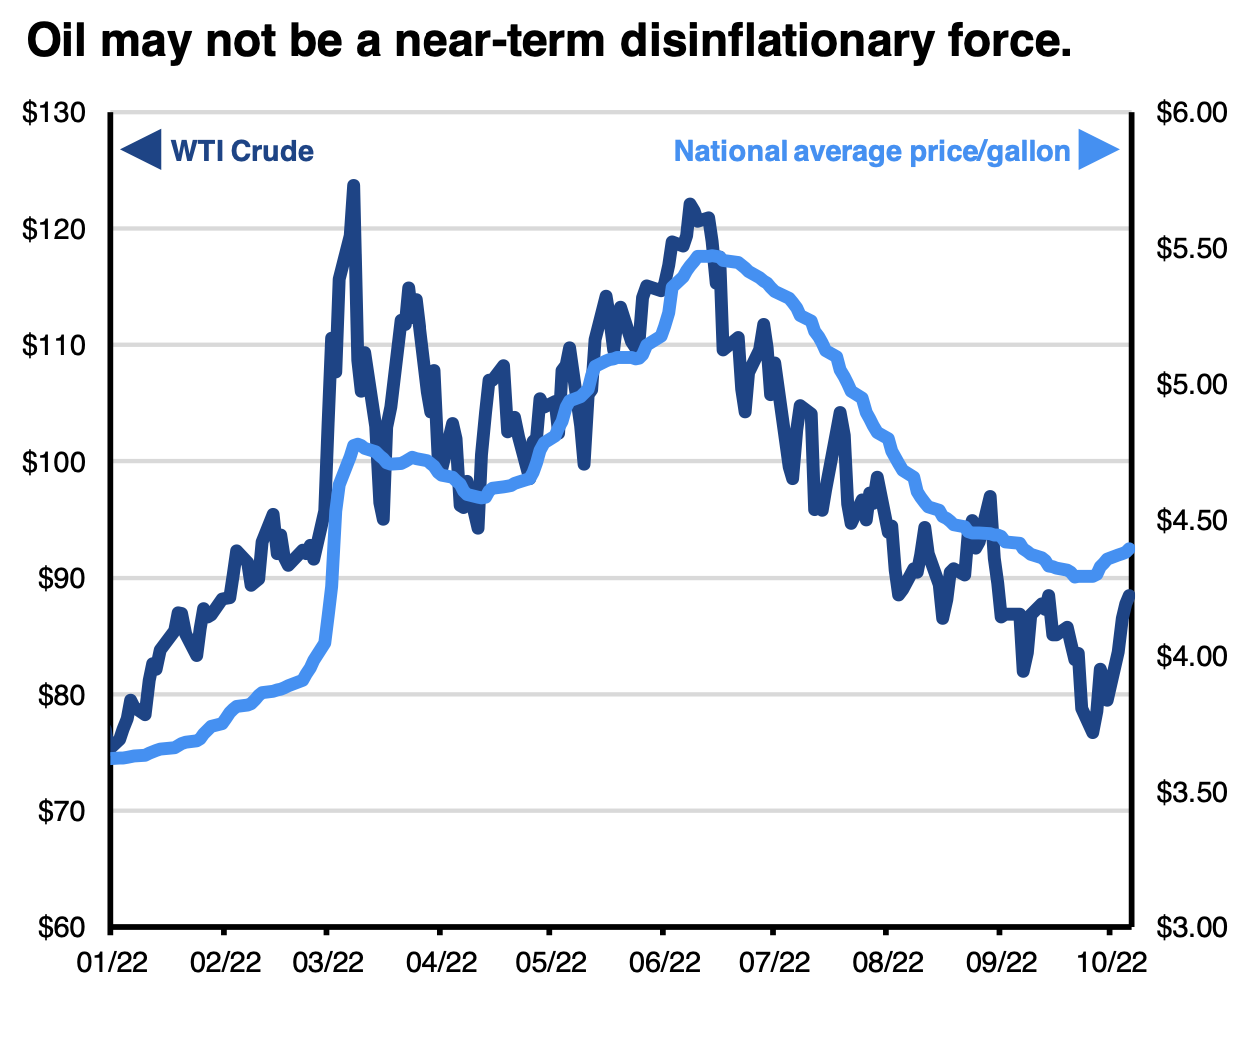
A final point of interest from last week’s market and economic activity came from OPEC+’s 33rd meeting which took place in Vienna, Austria. The oil cartel announced its plan to reduce oil output despite the misgivings from the United States and its allies in Europe. Putting the clear geopolitical ramifications of the decision aside, the reduction in supply from the cuts combined with an already precarious energy situation in Europe and the upcoming seasonally high demand period of winter has the potential to reverse what had recently been a disinflationary force in oil and gas prices. There will likely be more dominos to fall in the wake of OPEC+’s decision, including a probable continuation of the U.S.’ Strategic Petroleum Reserve releases and the potential of finding other sources of energy through methods such as dialing back sanctions on Venezuela. Regardless, it will be an important market to watch as a sharp rally in oil prices may further encourage continued Federal Reserve hawkishness.
Source: Bloomberg, J.P. Morgan Asset Management
Our overall view continues to be that the trajectory of the market for the remainder of the year will be primarily dictated by the path of inflation, investor sentiment regarding the Federal Reserve’s policy direction, and the general health of the underlying economy as it digests these policy actions and supply chain related factors. Geopolitical tensions will continue to be in the picture as well, with escalation or de-escalation being market narrative defining elements. Given this backdrop, we believe that our recent portfolio adjustments to reduce our fixed income duration and maintain high credit quality position us for the potentially continued volatile path ahead.
Despite this potential for more volatility, last week also saw the S&P 500 notch the index’s best two-day trading period since March 2020. At the close of last Tuesday, the S&P 500 was up 5.7% over the two-day stretch. We believe that the week’s performance, which saw volatile swings to both the upside and downside, drives home a strategic investing principle that we continue to repeat. That being that, investing success is about “time in the market”, not timing the market. What was the importance of being invested over this two-day period?
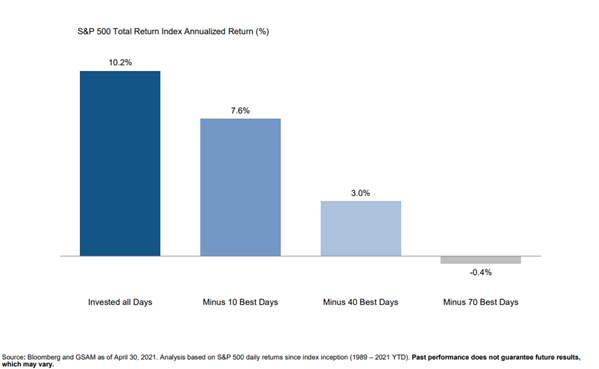
One of the most damaging mistakes to their returns an investor can make is missing out on the “best days” in the market; those days in which stocks exhibited their highest returns. The chart above, based on S&P 500 daily returns since 1989, shows how missing these best days impacted an investor’s portfolio. Remarkably, by missing only the 10 best days of market returns, an investor would have missed out on nearly 3% of additional annualized return. Over a 32-year time horizon, this missing return potential makes a lot of difference. Making reality even more difficult is that the best days in the market often occur near the worst days. In fact, studies have shown that roughly 60% of the S&P 500’s top single-day gains have occurred within two weeks of its ten largest single-day losses. An additional study looking at data from January 3, 2000, through April 19, 2020 (the month immediately following the bottom of the previous bear market) showed that not only did these best days happen near the worst days, but they often occurred the day after the worst days. Seven of the ten worst days in that time frame were followed the next day by either top 10 returns over that time frame or top 10 returns for their respective years.
If you have any questions, please schedule a meeting with our team of CFPs® and CPAs.

.png)